uNmINeD 0.19.37-dev
New uNmINeD development snapshot is available for download!
Changes:
- Fixed colors for Bedrock 1.20.70+ tree leaves
New uNmINeD development snapshot is available for download!
Changes:
New uNmINeD development snapshot is available for download!
Changes:
New uNmINeD development snapshot is available for download!
Changes:
--chunkprocessors=x option to limit CPU usage, where x is the number of chunks processed simultaneously. The default value is the number of your CPU threads.With these settings you can slow down uNmINeD and make it less CPU-hungry, preventing other running apps or games from lagging and overclocked/undercooled CPUs from “melting”.
Notes:
The number of CPU threads cannot be limited for a .NET application (however, you can use virtual machines or containers to limit the CPU usage of any application). The CPU limiter in uNmINeD only limits the number of chunks that can be processed simultaneously. The actual number of running threads can be higher than this.
New uNmINeD development snapshot is available for download!
Changes:
New uNmINeD development snapshot is available for download!
Changes:
New uNmINeD development snapshot is available for download!
Changes:
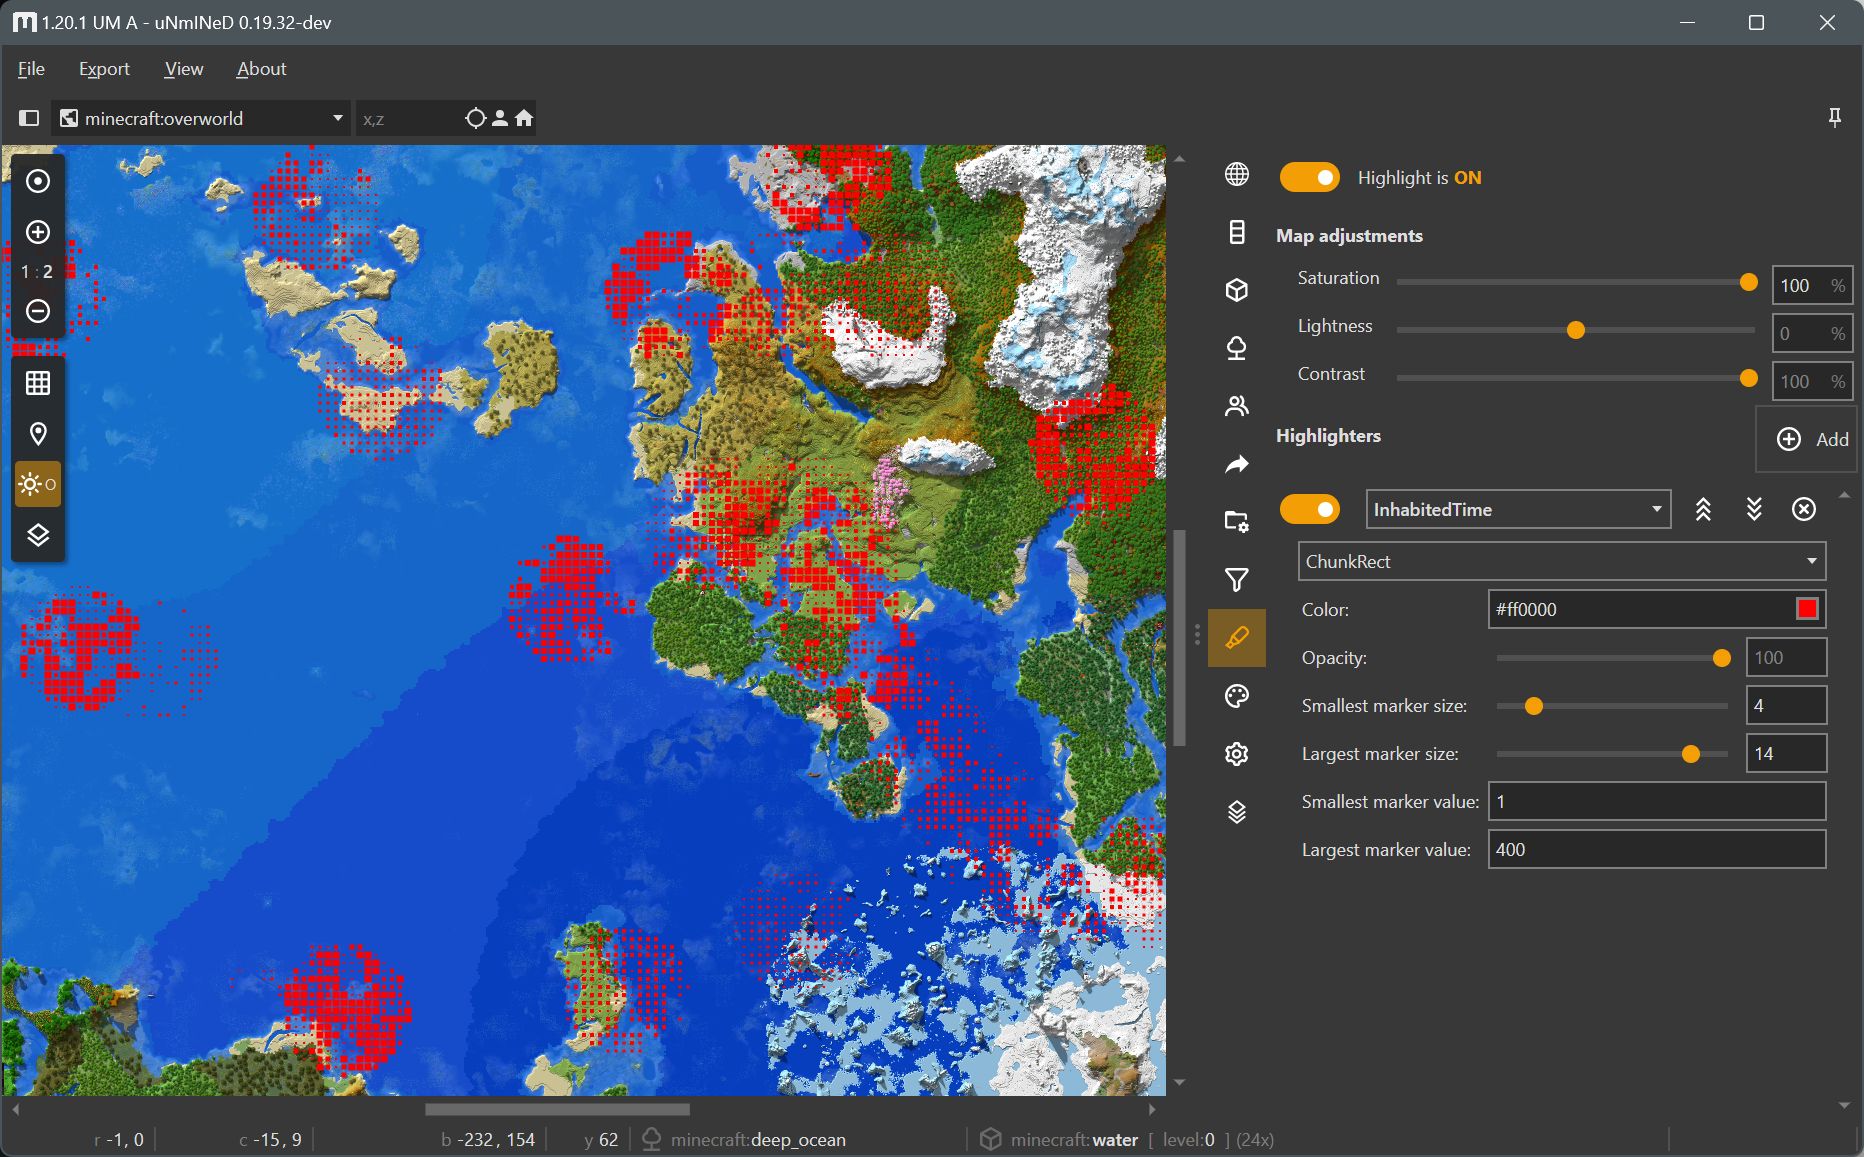
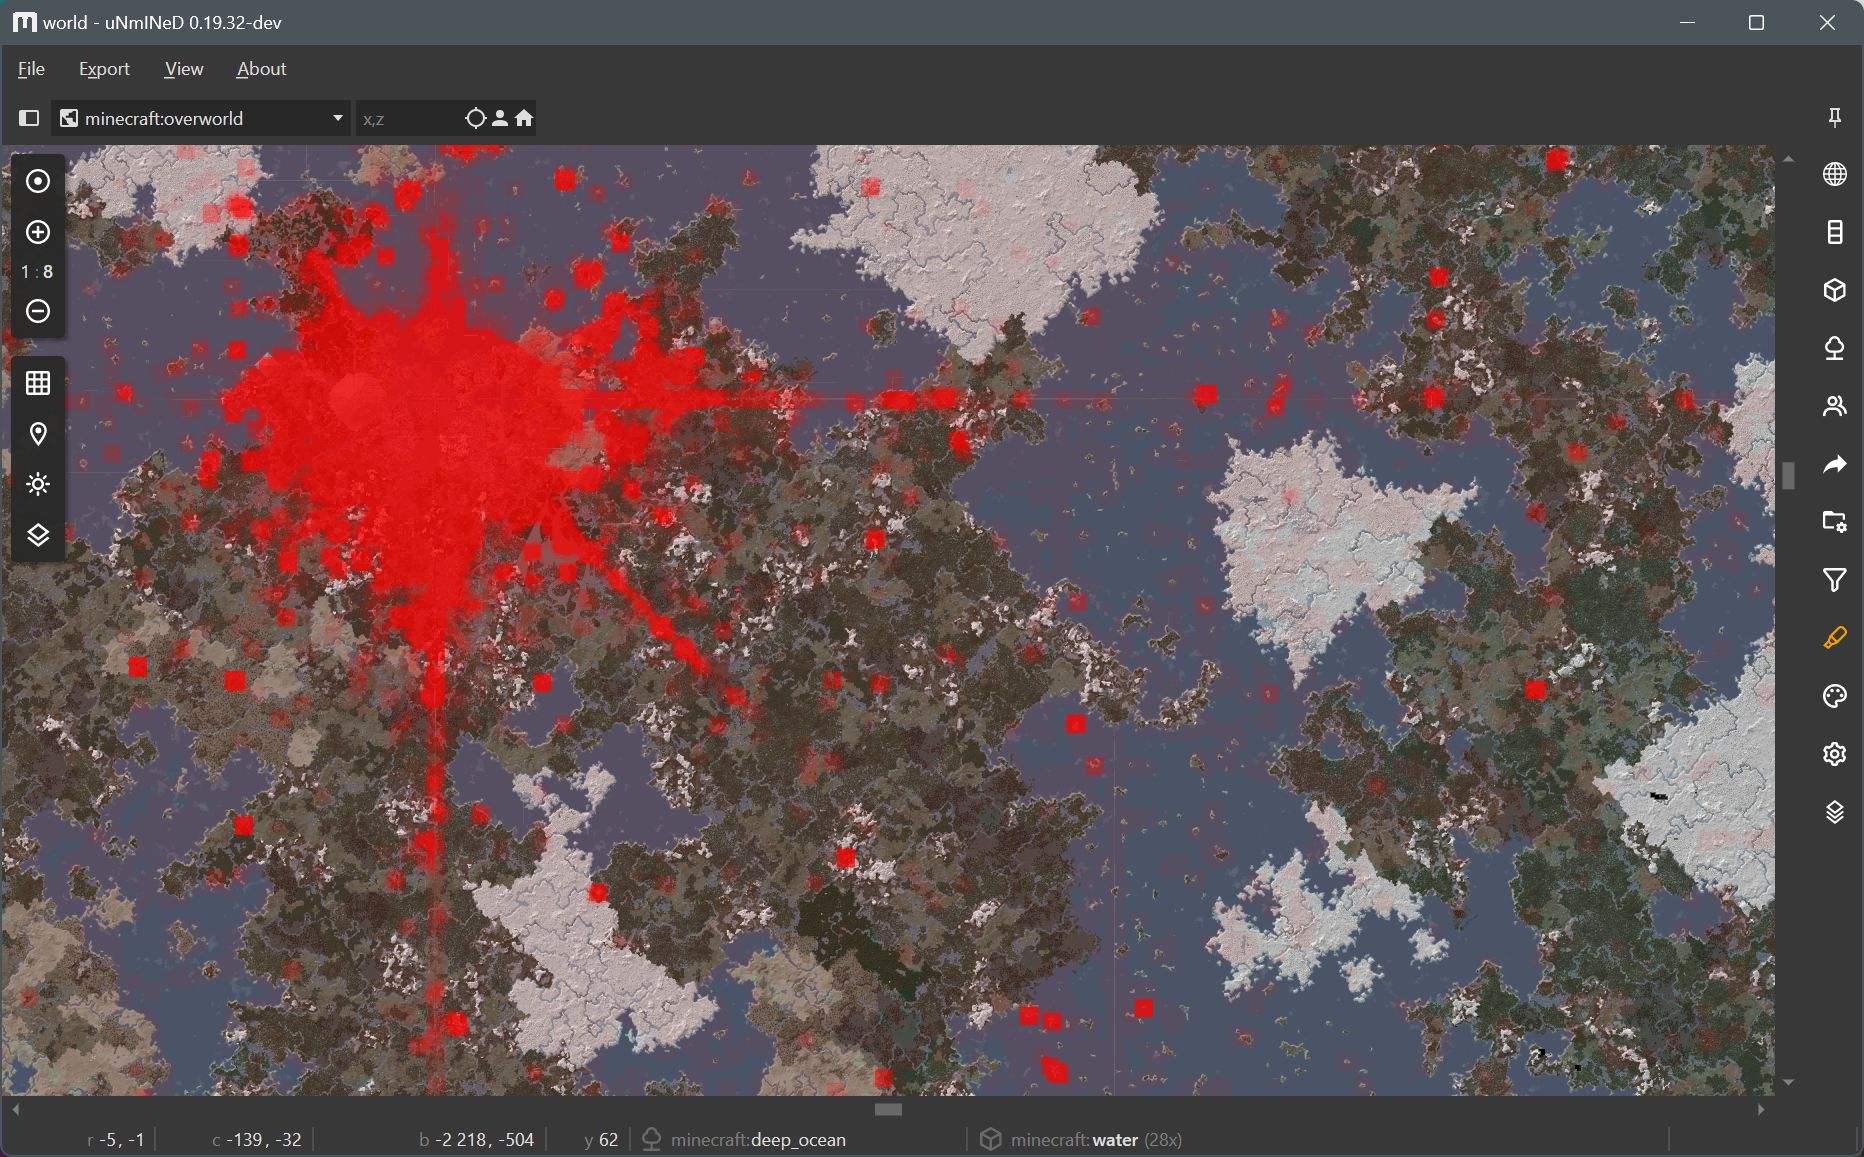
Inhabited time is the cumulative number of ticks players have been in a chunk. Minecraft uses this for regional difficulty. It can be used for creating a heatmap that shows the most visited chunks.
How to use:
Screenshot: